A coworker Ted from GSI used the Access 2000 Chart OCE tool for some nice-looking bar charts in a legacy database; when I looked for the tool in 2007 it was less-than-obvious. However, after playing around with the toolsets for half a day I discovered that it's basically the same graphing engine available in Excel -- just with a terrible interface.
This article summarizes some of the shortcomings (one needs to tweak their own query regardless of how the original is built in the interface), and does a better job than I would've showing you where to start:
http://www.vb123.com.au/toolbox/09_access/access2007charting.htm
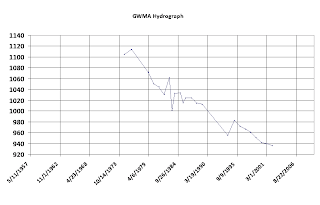
To see this in action at GSI check out the GWMA db > hydrograph > frmHydrographByDate > select your well and date range, load it, and click the "Chart" button at the bottom of the page (launches frmHydrographChart).
Shortcoming -- since I rely on a scalar query to pick the most recent measured elevation for each well, Jet cannot create a crosstab of this data so it's difficult to compare multiple wells in this interface without exporting to Excel.

No comments:
Post a Comment